Artículo Original

Soybean cultivar production under application of varying effective microorganism rates
Respuesta de variedades de soja a la aplicación de diferentes dosis de microorganismos eficaces

 Modesto Osmar Da Silva Oviedo dasilva_modesto@hotmail.com
Wilfrido Daniel Lugo Pereira wdlugo.26@hotmail.com
Modesto Osmar Da Silva Oviedo dasilva_modesto@hotmail.com
Wilfrido Daniel Lugo Pereira wdlugo.26@hotmail.com
Soybean cultivar production under application of varying effective microorganism rates
Siembra, vol. 13, núm. 1, e9189, 2026
Universidad Central del Ecuador

Esta obra está bajo una Licencia Creative Commons Atribución-NoComercial 4.0 Internacional.
Recepción: 13 Noviembre 2025
Revisado: 16 Febrero 2026
Aprobación: 18 Febrero 2026
Abstract: The objective of this study was to evaluate the response of soybean cultivars under the application of different doses of Effective Microorganisms [EM-1]. The field experiment was conducted at Estancia La Margarita II, San Pedro, Department of San Pedro, Paraguay, at an elevation of 200 m a.s.l., at coordinates 23°40′38.5″S, 56°54′24.7″W. A randomized complete block design was used, with eight treatments and three replications, totaling 24 experimental units in a 2 × 4 factorial arrangement: factor A = soybean cultivars and factor B = EM-1 dose. Data were subjected to analysis of variance, and means were compared using Tukey’s test at the 1% and 5% significance levels; regression analysis was also performed. Measurements included plant height at 30, 60, and 90 days after sowing [DAS], number of pods per plant, number of grains per pod, and yield (kg ha-1). The statistical analysis showed that plant height differed significantly for factor B (EM-1 dose) at 30 DAS and highly significantly for both factors at 60 and 90 DAS, with a significant interaction only at 90 DAS. For pods per plant, both factors and their interaction (A × B) were highly significant, whereas grains per pod showed no statistical differences. Regarding yield, significant differences were found for both factors; notably, the 30 L ha⁻¹ EM-1 dose achieved the highest yield (1,916.16 kg ha-1), corresponding to a 29.68% increase.
Keywords: effective microorganisms, grain yield, number of pods per plant, soybean.
Resumen: El objetivo del trabajo fue evaluar la respuesta de variedades de soja con aplicación de diferentes dosis de microorganismos eficaces [EM-1]. El experimento se instaló en condiciones de campo; en la estancia la Margarita II, San Pedro, Departamento de San Pedro Paraguay, con una elevación de 200 m s.n.m., con las coordenadas UTM 23°40'38,5"S 56°54'24,7"W. El diseño experimental utilizado fue el de bloques completos al azar, compuesto por ocho tratamientos y tres repeticiones totalizando 24 unidades experimentales con arreglo factorial de 2 × 4, el factor A: variedades de soja y factor B: Dosis de EM-1. Los valores obtenidos fueron sometidos a análisis de varianza, y las medias, comparadas entre sí, por la prueba de Tukey al 1 y 5%, además, se realizó el análisis de regresión. Las variables evaluadas fueron altura de plantas a los 30, 60 y 90 DDS, número de vainas por plantas, número de granos por vainas y rendimiento en kg ha-1. El análisis estadístico evidenció que la altura de planta presentó diferencias significativas para el factor B dosis de EM-1 a los 30 DDS y altamente significativas para ambos factores a los 60 y 90 DDS, con interacción significativa solo a los 90 DDS. Para el número de vainas por planta, ambos factores y su interacción (A × B) fueron altamente significativos, mientras que el número de granos por vaina no mostró diferencias estadísticas. En cuanto al rendimiento, se obtuvieron diferencias significativas para ambos factores, destacándose la dosis de 30 L ha⁻¹ de EM-1, que alcanzó el mayor rendimiento con 1.916,16 kg ha-1, equivalente a un incremento del 29,68 %.
Palabras clave: microorganismos eficaces, número de vainas por plantas, rendimiento, soja.
1. Introduction
Soybean (Glycine max L.) is a crop of high economic and strategic relevance worldwide (Mishra et al., 2024). Its grains are widely used in agro-industry, mainly for oil extraction, the manufacture of high-protein foods, and the formulation of balanced rations for animal feed (Zhi et al., 2020). Its nutritional value rests on a well-balanced chemical composition—characterized by high levels of proteins, oils, carbohydrates, isoflavones, and essential minerals—which positions it as one of the leading plant sources of protein and energy globally.
In Paraguay, the soybean planted area has shown sustained growth over time, rising from approximately one million to more than three million hectares. In the 2022–2023 season, the estimated average yield was 2,743 kg ha-1, with the departments of Alto Paraná, Canindeyú, Itapúa, Caaguazú, and San Pedro standing out as the country’s main soybean-producing regions (Cámara Paraguaya de Exportadores y Comercializadores de Cereales y Oleaginosas [CAPECO], 2023; Instituto de Biotecnología Agrícola [INBIO], 2023).
Likewise, the type and genetic characteristics of the varieties used by growers have a decisive influence on productivity levels, since each cultivar responds differently to edaphic conditions, the degree of weed competition, and the incidence of pests and diseases (Du et al., 2024; Fattah et al., 2020).
Effective Microorganisms [EM-1] represent a high-value biotechnological innovation aimed at sustainable agriculture, grounded in the synergistic interaction of functional microbial consortia capable of restoring soil biological balance and optimizing plant productivity. This biocomplex consists of a defined mixture of around 80 beneficial microbial strains—predominantly lactic acid bacteria, photosynthetic bacteria, yeasts, actinomycetes, and fermenting fungi—selected for their regenerative properties, plant-growth-promoting effects, and their ability to modulate edaphic and physiological processes that favor agroecosystem sustainability (Safwat & Matta, 2021; Sivasubramanian & Namasivayam, 2013).
This multi-species microbial consortium, formulated in a stable liquid medium, features the synergistic coexistence of beneficial strains capable of developing under aerobic and facultatively anaerobic conditions, exhibiting high metabolic and functional compatibility. The microorganisms present in EM-1 modify the rhizosphere microenvironment through fermentation and biotransformation processes, promoting the colonization of beneficial microbes, inhibiting phytopathogen development, and stimulating enzymatic and biogeochemical activity in the soil, thereby contributing to improvements in its biological fertility and ecological stability (Safwat & Matta, 2021).
In this context, the overarching objective was to evaluate the response of soybean cultivars under the application of different EM-1 doses.
2. Materials and Methods
The field experiment was established at Estancia La Margarita II (San Pedro, Department of San Pedro, Paraguay) from September 2024 to January 2025, at an elevation of 200 m a.s.l., at 23°40′38.5″S, 56°54′24.7″W. The local climate is characterized by a mean temperature of 24 °C, with summer maxima reaching up to 45 °C and winter minima down to 4 °C, with slight occurrences of frost (Dirección de Meteorología e Hidrología [DMH], 2025). Figure 1 presents the mean temperature and cumulative precipitation recorded during the experimental period.
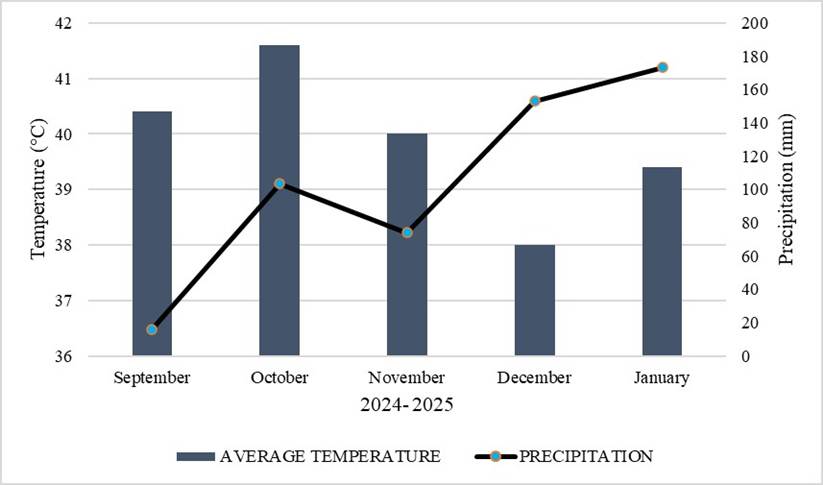
Figure 1
Mean temperature and precipitation from September 2024 to January 2025.
The soil type in the area belongs to the great group Alfisol and the Mollic subgroup (Molinas et al., 2024). Composite soil samples were taken from the 0–20 cm horizon of the experimental area for physical and chemical characterization. The results were: pH (water) = 6.16; organic matter (dag dm⁻³) = 1.55; Al³⁺ (cmol(+) dm⁻³) = 0.00; P (mg dm⁻³) = 4.86; K (cmol(+) dm⁻³) = 0.50; Ca (cmol(+) dm⁻³) = 2.59; Mg (cmol(+) dm⁻³) = 0.60; S (mg dm⁻³) = 7.91; Fe (mg dm⁻³) = 68.60; Cu (mg dm⁻³) = 1.91; Zn (mg dm⁻³) = 4.50; B (mg dm⁻³) = 0.28; Mn (mg dm⁻³) = 57.40; and texture by feel = sandy loam.
A randomized complete block design [RCBD] was used, with eight treatments and three replications in a two-factor scheme: factor A = soybean varieties and factor B = EM-1 dose. Each experimental unit measured 10 × 10 m (100 m² per plot). The total experimental area was 3,196 m², considering 2-m alleys between blocks and 2-m spacing between experimental units. The treatments used are shown in Table 1.
| Treatment | Factor A | Factor B | Unit |
| Cultivar | EM-1 dose* | ||
| T1 | Var 1 | 0 | L ha-1 |
| T2 | 10 | L ha-1 | |
| T3 | 20 | L ha-1 (*) | |
| T4 | 30 | L ha-1 | |
| T5 | Var 2 | 0 | L ha-1 |
| T6 | 10 | L ha-1 | |
| T7 | 20 | L ha-1 (*) | |
| T8 | 30 | L ha-1 |
Soybean seeds from two different varieties were used, both with an indeterminate growth habit: Var 1 with an estimated cycle of 116 to 120 days, and Var 2 with an estimated cycle of 92 to 116 days. Sowing was carried out in a field managed under no-till for the previous five years, at a density of 11 seeds m⁻¹ of row (equivalent to 22 seeds m⁻²) with 0.45 m row spacing. Each plot had 22 rows, each 10 m long. Measurements were taken on the five central rows, discarding 2.5 m at each end of the experimental unit and the five outer rows to avoid border effects. Seeds were treated with the fungicides fludioxonil + metalaxyl and the insecticide fipronil. Seeds were inoculated with Bradyrhizobium japonicum. For weed control, glyphosate 66% formulation was applied at 2 L ha⁻¹ two weeks before sowing.
The planter was calibrated to apply 300 kg ha⁻¹ of the mineral fertilizer 00-30-10; the final gearing settings were 18 teeth on the drive sprocket and 22 teeth on the driven sprocket.
The activation of EM-1 was carried out using the following proportion: 5% EM-1, 5% sugarcane molasses, and 90% chlorine-free water. The mixture was placed in an airtight container and allowed to ferment for 10 days in an environment protected from direct sunlight. After this period, EM-1 was converted into Activated EM [AEM] ready for use.
In practical terms, the ratio applied was: 1 liter of EM-1 + 1 liter of sugarcane molasses + 18 liters of chlorine-free water, resulting in a total of 20 liters of AEM.
For the 10 L ha⁻¹ treatment, the same procedure was followed, proportionally splitting from the 20 L ha⁻¹ product-label recommendation; for the 30 L ha⁻¹ treatment, an additional 10 L was added to reach the target dose.
AEM was applied to soybean plants three times, splitting the total dose, using a backpack sprayer: (i) at sowing, (ii) 20 days after emergence, and (iii) at the onset of flowering.
One month after sowing, a spray was applied for insect and weed control. For defoliating and sucking insects, a tank mix of acetamiprid (100 g ha⁻¹), emamectin benzoate (24 g ha⁻¹), and lufenuron (75 g ha⁻¹) was used. Simultaneously, for post-emergence weeds, glyphosate 66% was applied at 2 L ha⁻¹ to control both broadleaf and grass species. Two months after sowing, a second insecticide application with the same mixture (acetamiprid 100 g ha⁻¹ + emamectin benzoate 24 g ha⁻¹ + lufenuron 75 g ha⁻¹) was made to maintain crop protection. All sprays were performed with a tractor-drawn boom sprayer, using 150 L ha⁻¹ of water under favorable environmental conditions to ensure adequate canopy coverage.
Harvest was carried out manually at the end of the crop cycle, observing border effects. After harvest, pods were cleaned and threshed; grain yield per treatment was determined using a precision balance. The useful plot consisted of five rows × 5 m (central area of each experimental unit), totaling 11.25 m².
The measured variables were (a) Plant height: randomly selected plants from the useful area were measured at 30, 60, and 90 days after sowing (DAS) with a measuring tape, from the stem base to the last shoot; plot means were expressed in cm. (b) Pods per plant: counted on a sample of ten representative plants per plot. (c) Grains per pod: counted on a sample of ten representative plants per plot; means expressed as grains pod⁻¹. (d) Grain yield (kg ha⁻¹): determined by harvesting the sampling area of each experimental unit and weighing the grain on a digital balance.
Data for the study variables were analyzed with AGROESTAT (Barbosa & Maldonado, 2015). An analysis of variance [ANOVA] was performed at a 95% confidence level (α = 0.05) to test for treatment effects. For variables showing significant differences, Tukey’s test was applied at p < 0.05.
3. Results
3.1. Plant height
Table 2 presents the results of Tukey’s test for soybean cultivar and EM-1 dose. At 30 DAS, there were no significant differences for factor A (cultivar), whereas factor B (EM-1 dose) showed highly significant differences; the greatest height was observed with 20 L ha⁻¹ EM-1 (21.50 cm).
At 60 and 90 DAS, both factors exhibited highly significant effects. For factor A, Variety 1 reached the greatest heights (48.66 and 62.25 cm, respectively). For factor B, the best performance again corresponded to 20 L ha⁻¹ EM-1 (50.00 and 65.16 cm at 60 and 90 DAS, respectively).
| Treatment | Description | Height (cm) | ||
| 30 DAS | 60 DAS | 90 DAS | ||
| Cultivar | (ns) | (**) | (**) | |
| Var 1 | 20.33 | 48.66 a | 62.25 a | |
| Var 2 | 20.83 | 47.08 b | 61.00 b | |
| EM-1 dose (L ha-1) | (*) | (**) | (**) | |
| 20 | 21.50 a | 50.00 a | 65.16 a | |
| 30 | 20.33 ab | 48.66 b | 63.16 b | |
| 10 | 20.66 ab | 47.33 c | 61.66 b | |
| 0 | 19.83 b | 45.50 d | 56.50 c | |
| Fc (A) | 2.08ns | 28.39** | 10.94** | |
| Fc (B) | 4.08* | 41.82** | 96.10** | |
| Fc (A × B) | 2.24ns | 0.29ns | 7.44** | |
| CV (%) | 4.12 | 1.52 | 1.50 | |
| GM | 20.53 | 47.87 | 61.62 | |
Note: ns = not significant; * = significant (Tukey’s test, p < 0.05); ** = highly significant (Tukey’s test, p < 0.01), CV = coefficient of variation.
Figure 2 presents the results of the unfolding of factor B within factor A, showing soybean plant height as a function of EM-1 dose. The data were fitted to a quadratic regression model, with coefficients of determination (R²) of 0.99 for var 1 and 0.89 for var 2, indicating a high-quality fit. The resulting quadratic equation adequately describes the relationship between EM-1 dose (x, L ha⁻¹) and plant height (y, cm), showing that the 20 L ha⁻¹ dose provided the best results, 64.66 cm plant⁻¹ for var 1 and 65.66 cm plant⁻¹ for var 2, whereas the control treatment recorded the lowest heights.
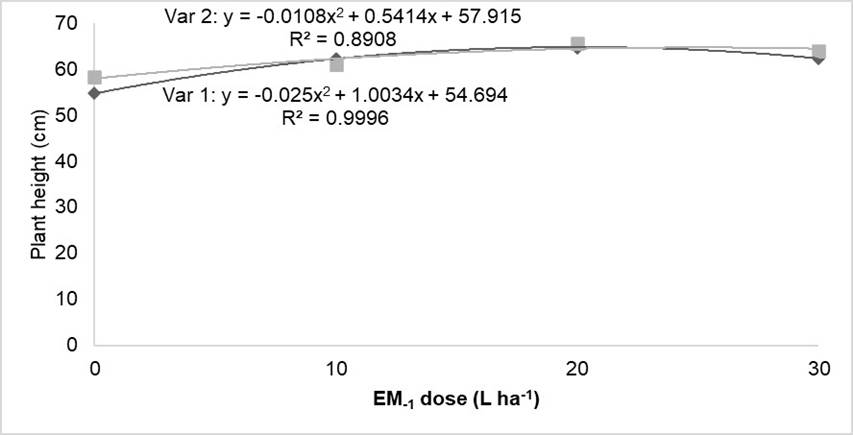
Figure 2
Regression analysis of plant height in soybean cultivars as affected by the application of EM-1.
3.2. Pods per plant and grains per pod
Table 3 presents Tukey’s test results for soybean cultivar and EM-1 dose on pods per plant and grains per pod. For pods per plant, both factors and their interaction (A × B) were highly significant. The var 2 showed the highest mean (50.08 pods plant⁻¹), while the 30 L ha⁻¹ EM-1 dose yielded the best result (57.16 pods plant⁻¹). For grains per pod, there were no significant differences for either factor or their interaction. Agronomically, the greatest grains-per-pod mean among cultivars was observed in var 1 (4.33 grains pod⁻¹). Across EM-1 doses, application treatments were numerically similar (≈ 4.50 grains pod⁻¹), whereas the 0 L ha⁻¹ control showed the lowest mean (3.66 grains pod⁻¹), suggesting a positive—though not statistically significant—influence of EM-1 on reproductive efficiency.
| Treatment | Description | Pods per plant | Grains per pod |
| Cultivar | (**) | (ns) | |
| Var 1 | 50.08 a | 4.33 | |
| Var 2 | 55.75 b | 4.25 | |
| EM-1 dose (L ha-1) | (**) | (ns) | |
| 30 | 57.16 a | 4.50 | |
| 20 | 55.16 b | 4.50 | |
| 10 | 52.50 c | 4.50 | |
| 0 | 46.83 d | 3.66 | |
| Fc (A) | 140.12** | 0.12ns | |
| Fc (B) | 87.72** | 3.07ns | |
| Fc (A × B) | 10.67** | 0.45ns | |
| CV (%) | 2.21 | 13.57 | |
| GM | 52.91 | 4.29 | |
For grains per pod, no significant differences were detected for either factor, nor for their interaction. Agronomically, among cultivars, the highest grains-per-pod mean was obtained with var 1, reaching 4.33 grains pod⁻¹. With respect to EM-1 doses, numerically similar values were observed among the application treatments, averaging 4.50 grains pod⁻¹, whereas the lowest value corresponded to the 0 L ha⁻¹ control, suggesting a positive influence of EM-1 on the crop’s reproductive efficiency, albeit without statistically significant differences.
The data were fitted to a positive linear equation, with coefficients of determination (R²) of 0.99 for var 1 and 0.86 for var 2, indicating a strong association between EM-1 dose and pods per plant (Figure 3). These results suggest that var 2 exhibited a more consistent, linear response to increasing doses, whereas var 1, although positive, showed a comparatively lower response.
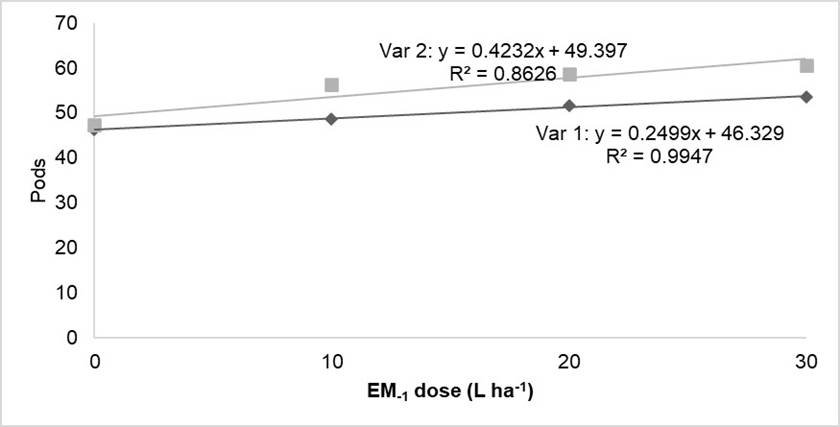
Figure 3
Regression analysis for pods per plant in soybean cultivars as a function of EM-1 dose (factor B within factor A).
3.3 Yield
From Table 4, both factors (variety and EM-1 dose) showed significant effects on yield, while the interaction was not significant. Varietally, var 2 produced the higher mean (1,699.75 kg ha⁻¹). By dose, 30 L ha⁻¹ EM-1 achieved the highest yield (1,916.16 kg ha⁻¹), a +438.50 kg ha⁻¹ increase over the control, evidencing a positive EM-1 effect. Additionally, no statistically significant differences were detected between the 0 and 10 L ha⁻¹ treatments; therefore, the application of 10 L ha⁻¹ would constitute an unnecessary cost for the producer.
| Treatment | Description | Yield |
| (kg ha-1) | ||
| Cultivar | (*) | |
| Var 2 | 1,699.75 a | |
| Var 1 | 1,661.08 b | |
| EM-1 dose (L ha-1) | (**) | |
| 30 | 1,916.16 a | |
| 20 | 1,799.50 b | |
| 0 | 1,477.66 c | |
| 10 | 1,528.33 c | |
| Fc (A) | 7.22* | |
| Fc (B) | 215.70** | |
| Fc (A × B) | 0.70ns | |
| CV (%) | 2.09 | |
| GM | 1,680.41 | |
Soybean grain yield displays a linear response pattern, consistent with expectations for this variable under favorable environmental conditions (Figure 4).
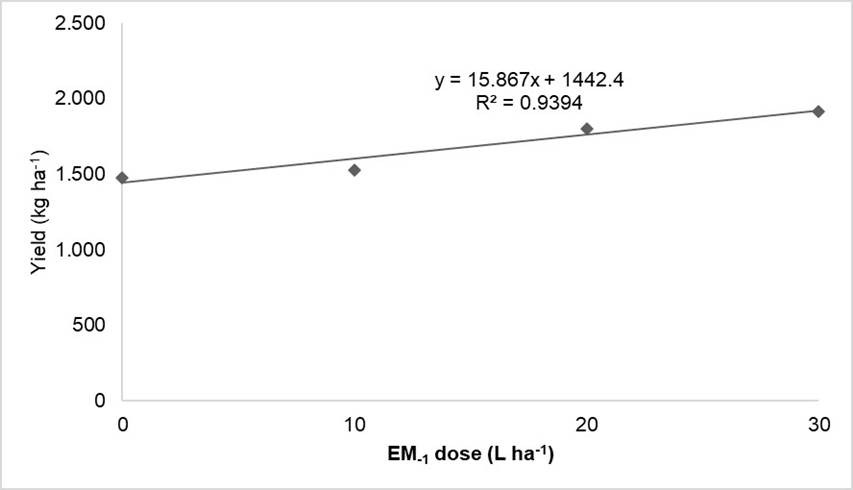
Figure 4
Regression analysis of soybean grain yield as affected by the application of EM-1.
A positive trend line described by the equation y = 15.867x + 1,442.4 shows that as EM-1 dose increases, soybean yield rises proportionally. The coefficient of determination (R² = 0.93) indicates that 93% of the variation in yield is explained by the applied EM-1 levels, while the remaining 7% is attributable to uncontrolled external factors in the experimental model (e.g., environmental or edaphic variation). This high R² reflects a strong relationship between EM-1 dose and soybean productivity, confirming EM-1’s effectiveness in improving yield.
4. Discussion
According to Gibbert et al. (2018), in a study on agronomic traits of two soybean cultivars, the cultivar nidera 5909 averaged 91.83 cm in plant height. In the present study it reached ~61 cm, likely reflecting drought conditions that constrained vegetative growth relative to its potential, considering that Battisti et al. (2018) and Empresa Brasileira de Pesquisa Agropecuária (EMBRAPA, 2020) indicate that soybean requires between 500 and 650 mm of water throughout its growth cycle to adequately express its growth potential.
According to Gawęda et al. (2018), the incorporation of EM in combination with mineral fertilization favored main-stem growth and nodulation—attributes directly associated with greater plant height. Likewise, Moretti et al. (2021) reported that the symbiotic interaction between beneficial microorganisms and the soybean rhizosphere can alleviate oxidative stress and sustain vegetative growth under drought conditions, reinforcing the role of EM in promoting crop vitality and physiological efficiency.
These results demonstrate the positive effect of EM-1 on the vegetative growth of soybean, attributed to the enhancement of rhizosphere microbiota and improved nutrient availability. These findings are consistent with those reported by Cvijanović et al. (2024), who observed that the application of 20 L ha⁻¹ of EM, supplemented with 5 L ha⁻¹ of foliar doses, significantly increased soil biogenicity, plant height, and grain yield in soybean, achieving improvements of up to 13.29% compared to the control. Similarly, in the present study, an increase of 15.32% was recorded, confirming the effectiveness of EM as a biotechnological strategy capable of enhancing the physiological performance and productive efficiency of soybean under experimental conditions.
These findings are consistent with Favoretto et al. (2025), who note that genetic differences among soybean cultivars determine the number of reproductive structures, photoassimilate distribution, and grain-filling capacity, directly influencing yield. Likewise, Costa-Neto et al. (2023) and Vitale et al. (2024) emphasize that genotype × environment (G × E) interactions play a decisive role in the expression of these traits, explaining variability among genotypes across edaphoclimatic conditions.
In turn, Kumar et al. (2017) and Gupta et al. (2021) reported that inoculation with microbial consortia based on Rhizobium, Azospirillum, and Bacillus spp. improves soil biological fertility and contributes to increasing the number of pods and grains per plant in soybean and other legumes. Along the same lines, Santos et al. (2019) observed that microbial biostimulants can enhance the crop’s reproductive development, especially under moderate stress, although effects are not always statistically significant.
Lavayen Toala (2024) found that EM increased soybean yield, with 60 L ha⁻¹ attaining 3,450 kg ha⁻¹ (~9% over the control). Comparably, the present study observed a 29.68% increase, though absolute yields were likely constrained by drought, limiting total yield potential despite EM’s positive effect. Similarly, Cvijanović et al. (2024) reported significant yield gains (≈14–16%) when EM was combined with mineral fertilization [NPK]. In line with this, 30 L ha⁻¹ EM-1 here produced an even greater relative increase, underscoring EM-1’s bio-stimulant efficacy, even under water-limited conditions.
5. Conclusions
The application of EM-1 had a positive and significant effect on soybean growth and yield, with improvements in plant height, pods per plant, and grain yield—particularly at 30 L ha⁻¹. These findings confirm that EM-1 is a sustainable biotechnological strategy that enhances crop productivity, even under water-stress conditions, thereby supporting a more efficient and environmentally responsible agriculture.
Contributor roles
-
Samuel López Salinas: conceptualization, formal analysis, funding acquisition, investigation, methodology, project administration, supervision, validation, visualization, writing – review & editing.
-
Modesto Osmar Da Silva Oviedo: conceptualization, formal analysis, funding acquisition, investigation, methodology, project administration, supervision, validation, visualization, writing – review & editing.
-
Wilfrido Daniel Lugo Pereira: conceptualization, formal analysis, funding acquisition, investigation, methodology, project administration, supervision, validation, visualization, writing – review & editing.
Data availability
Data will be made available on request.
Use of Artificial Intelligence
The authors declare that no artificial intelligence has been used in the preparation of the manuscript.
Ethical Implications
The authors declare that there are no ethical implications.
Conflict of Interest
The authors declare that they have no affiliation with any organization with a direct or indirect financial interest that could have appeared to influence the work reported.
References
Barbosa, J., & Maldonado W. (2015). AgroEstat – Online statistical analyses of experimental designs. https://www.etp.com.py/libro/Experimenta%C3%A7ao-Agronomica--AgroEstat-104437
Battisti, R., Sentelhas, P. C., Pascoalino, J. A. L., Sako, H., de Sá Dantas, J. P., & Moraes, M. F. (2018). Soybean yield gap in the areas of yield contest in Brazil. International Journal of Plant Production, 12(3), 159–168. https://doi.org/10.1007/s42106-018-0016-0
Cámara Paraguaya de Exportadores y Comercializadores de Cereales y Oleaginosas [CAPECO]. (2023). Área de siembra, producción y rendimiento. CAPECO. https://capeco.org.py/area-de-siembra-produccion-y-rendimiento/
Costa-Neto, G., Crespo-Herrera, L., Fradgley, N., Gardner, K., Bentley, A. R., Dreisigacker, S., Fritsche-Neto, R., Montesinos-López, O. A., & Crossa, J. (2023). Envirome-wide associations enhance multi-year genome-based prediction of historical wheat breeding data. G3, 13(2). https://doi.org/10.1093/g3journal/jkac313
Cvijanović, G., Đukić, V., Bajagić, M., Mamlić, Z., Šević, B., Cvijanović, V., & Ivetić, A. (2024a). Influence of Effective Microorganisms and mineral fertilizers on soil biogenicity parameters and soybean yield. International Journal of Innovative Approaches in Agricultural Research, 8(4), 324–335. https://doi.org/10.29329/ijiaar.2024.1109.5
Dirección de Meteorología e Hidrología [DMH]. (2025). Datos Actuales de la Red de Estaciones Meteorológicas Automáticas de la DMH/DINAC. Estaciones Meteorológicas Automáticas. https://www.meteorologia.gov.py/emas/
Du, K., Huang, J., Wang, W., Zeng, Y., Li, X., & Zhao, F. (2024). Monitoring low-temperature stress in winter wheat using TROPOMI solar-induced chlorophyll fluorescence. IEEE Transactions on Geoscience and Remote Sensing, 62, 1–11. https://doi.org/10.1109/TGRS.2024.335114
Empresa Brasileira de Pesquisa Agropecuária [EMBRAPA] (2020). Tecnologias de produção de soja – Região Central do Brasil 2020 (Sistemas de Produção, No. 16). Embrapa Soja. https://www.embrapa.br/soja
Fattah, A., Sjam, S., Daud, I. D., Dewi, V. S., & Ilyas, A. (2020). Impact of armyworm Spodoptera litura (Lepidoptera: Noctuidae) attack: Damage and loss of yield of three soybean varieties in South Sulawesi, Indonesia. Journal of Crop Protection, 9, 483–495.
Favoretto, V. R., Murithi, H. M., Leles, E. P., da Santos, F. M., Chigeza, G., Goldsmith, P., Coyne, D., & Clough, S. J. (2025). Soybean rust‐resistant and tolerant varieties identified through the Pan‐African Trial Network. Pest Management Science, 81(6), 2769–2775. https://doi.org/10.1002/ps.8639
Gawęda, D., Haliniarz, M., Woźniak, A., & Harasim, E. (2018). Yield, seed quality and nodule formation of soybean under application of effective microorganisms. Acta Agrophysica, 25(1), 35–43. https://doi.org/10.31545/aagr0003
Gibbert, K., Melgarejo, M., Amarilla, D., Bogado, M., Bogado, B., & Jandrey, E. (2018). Características agronómicas de dos cultivares de soja sobre diferentes densidades de semeadura. Cultivando Saber, 9(3), 61–68. https://cultivandosaber.fag.edu.br/index.php/cultivando/article/view/875
Gupta, K., Dubey, N. K., Singh, S. P., Kheni, J. K., Gupta, S., & Varshney, A. (2021). Plant Growth-Promoting Rhizobacteria (PGPR): Current and future prospects for crop improvement. In A. N. Yadav, J. Singh, C. Singh, & N. Yadav (eds.), Current Trends in Microbial Biotechnology for Sustainable Agriculture (pp. 203–226). Springer Singapore. https://doi.org/10.1007/978-981-15-6949-4_9
Instituto de Biotecnología Agrícola [INBIO]. (2023). Estimación de superficies, soja–arroz–maíz, campaña agrícola 2022–2023 con teledetección satelital y sistemas de información geográfica (SIG). INBIO. https://inbio.org.py/wp-content/uploads/2024/01/10-Zafra-Estimacion-superficie-zafra-2022-2023_.pdf
Kumar, A., Maurya, B. R., Raghuwanshi, R., Meena, V. S., & Tofazzal Islam, M. (2017). Co-inoculation with enterobacter and rhizobacteria on yield and nutrient uptake by wheat (Triticum aestivum L.) in the alluvial soil under indo-gangetic plain of India. Journal of Plant Growth Regulation, 36(3), 608–617. https://doi.org/10.1007/s00344-016-9663-5
Lavayen Toala, G. J. (2024). Estrategias biotecnológicas para el uso de microorganismos en cultivos sustentables. Sapiens Sciences International Journal, 2(1), e-21008. https://sapiensdiscoveries.com/index.php/sapiens_sciences/article/view/68
Mishra, R., Tripathi, M. K., Sikarwar, R. S., Singh, Y., & Tripathi, N. (2024). Soybean (Glycine max L. Merrill): a multipurpose legume shaping our world. Plant Cell Biotechnology and Molecular Biology, 25(3–4), 17–37. https://doi.org/10.56557/pcbmb/2024/v25i3-48643
Molinas, A. S. (2024). Tipos de suelos en la región oriental del Paraguay según el sistema Soil Taxonomy - "Racionalización del uso de la tierra" MAG/BM 1995. https://ing-alfredo-molinas.blogspot.com/2025/07/tipos-de-suelos-en-la-region-oriental.html
Moretti, L. G., Crusciol, C. A. C., Bossolani, J. W., Calonego, J. C., Moreira, A., Garcia, A., Momesso, L., Kuramae, E. E., & Hungria, M. (2021). Beneficial microbial species and metabolites alleviate soybean oxidative damage and increase grain yield during short dry spells. European Journal of Agronomy, 127, 126293. https://doi.org/10.1016/j.eja.2021.126293
Safwat, S. M., & Matta, M. E. (2021). Environmental applications of Effective Microorganisms: a review of current knowledge and recommendations for future directions. Journal of Engineering and Applied Science, 68(1), 48. https://doi.org/10.1186/s44147-021-00049-1
Santos, M. S., Nogueira, M. A., & Hungria, M. (2019). Microbial inoculants: reviewing the past, discussing the present and previewing an outstanding future for the use of beneficial bacteria in agriculture. AMB Express, 9(1), 205. https://doi.org/10.1186/s13568-019-0932-0
Sivasubramanian, S., & Namasivayam, S. K. R. (2013). Evaluation of phenol degradation by effective microorganism (EM) technology with EM-1. African Journal of Microbiology Research, 7(32), 4117–4122. https://doi.org/10.5897/AJMR12.1077
Vitale, P., Crossa, J., Vaccino, P., & de Vita, P. (2024). Defining the target population of environments for wheat (Triticum aestivum L.) breeding in Italy based on historical data. Plant Breeding, 143(4), 518–533. https://doi.org/10.1111/pbr.13192
Zhi, Y., Sun, T., Zhou, Q., & Leng, X. (2020). Screening of safe soybean cultivars for cadmium contaminated fields. Scientific Reports, 10, 12965. https://doi.org/10.1038/s41598-020-69803-4
Notas de autor
samuel.lopezpy@gmail.com
Información adicional
e-location: e9189
Información adicional
redalyc-journal-id: 6538